
Enable and view graphical traffic reports, visitor analytics, and storage usage metrics inside your Plesk dashboard.
Monitoring your website’s traffic and storage health is vital for maintaining optimal online performance. The Plesk hosting control panel includes built-in analytics utilities that generate comprehensive, graphical reports on your website visitors, data transfer metrics, and storage limits. This guide walks you through enabling your preferred web statistics software, accessing visitor charts, and checking your real-time data reports on your 1-grid hosting account.

Before You Begin
Before attempting to pull up or configure your traffic charts inside Plesk, make sure you have:
- Access to your 1-grid Customer Zone
- An active web hosting package running a Plesk dashboard
- The specific domain name whose visitor metrics you want to audit
💡 Context: Plesk records and compiles background web traffic server data automatically. However, to translate raw server logs into readable charts, you must ensure a web statistics software engine is actively assigned to your domain container settings.
Follow These Steps
1. Open Your Plesk Hosting Account
Log in to your 1-grid Customer Zone, locate the web hosting service you want to manage, and launch your central Plesk Control Panel dashboard.
2. Configure Your Web Statistics Engine
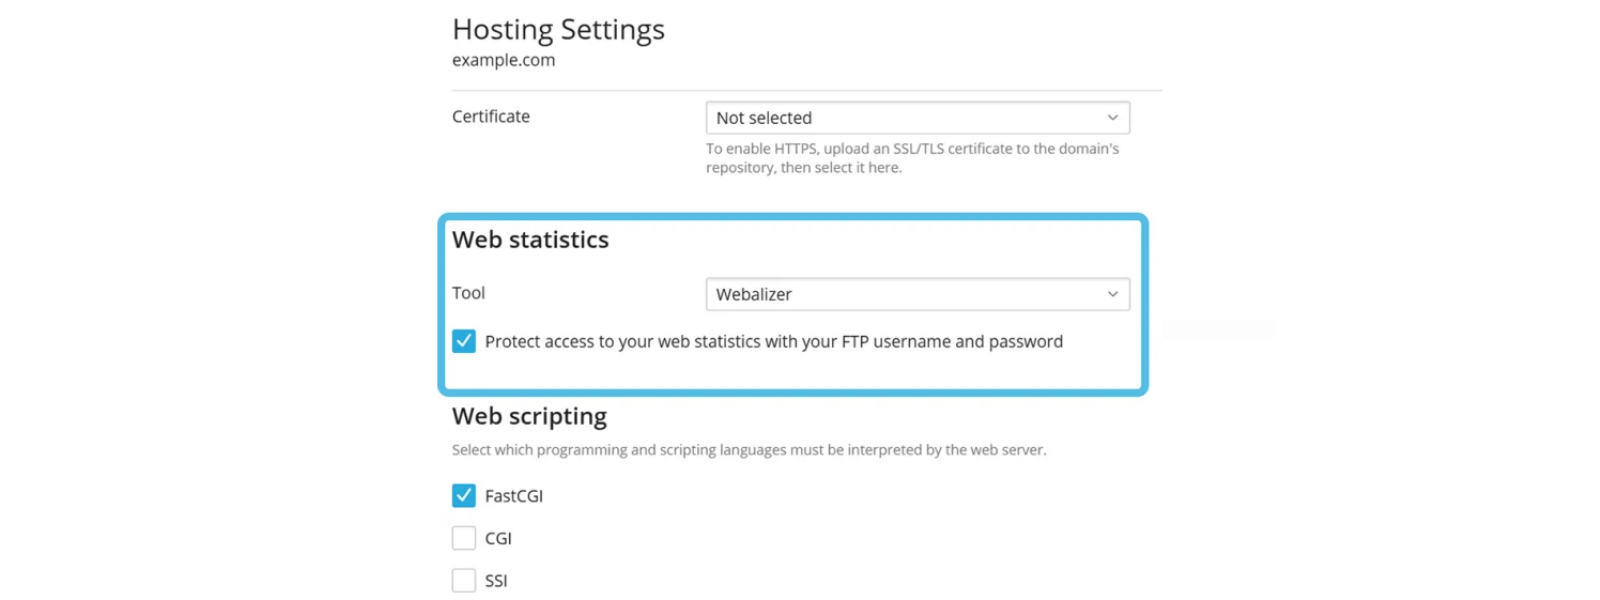
Navigate to your primary domain card and go to: Websites & Domains → Hosting & DNS → Hosting. Scroll down to the Web Statistics menu options dropdown, select your preferred analytical software wrapper application from the list, and save your changes.
3. Open Visitor Statistics
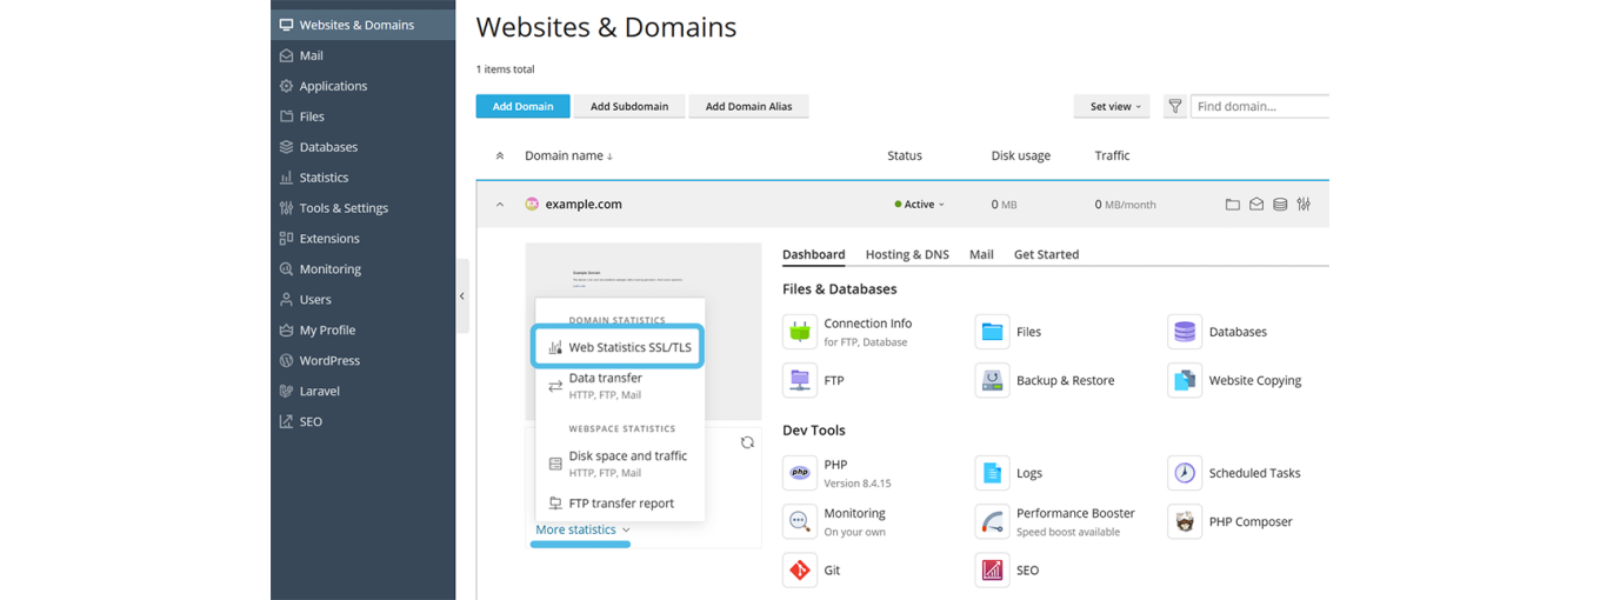
Return to the primary Websites & Domains section dashboard screen layout. Scroll down to the Statistics module grid, click on the More statistics link text string, and then select Web Statistics (or choose Web Statistics SSL/TLS depending on your traffic routing type).
- Action: A secure, secondary window browser tab will initialise, rendering comprehensive graphical user summaries, geographic tables, and hits tracking metrics.
4. Open Disk and Traffic Usage Reports
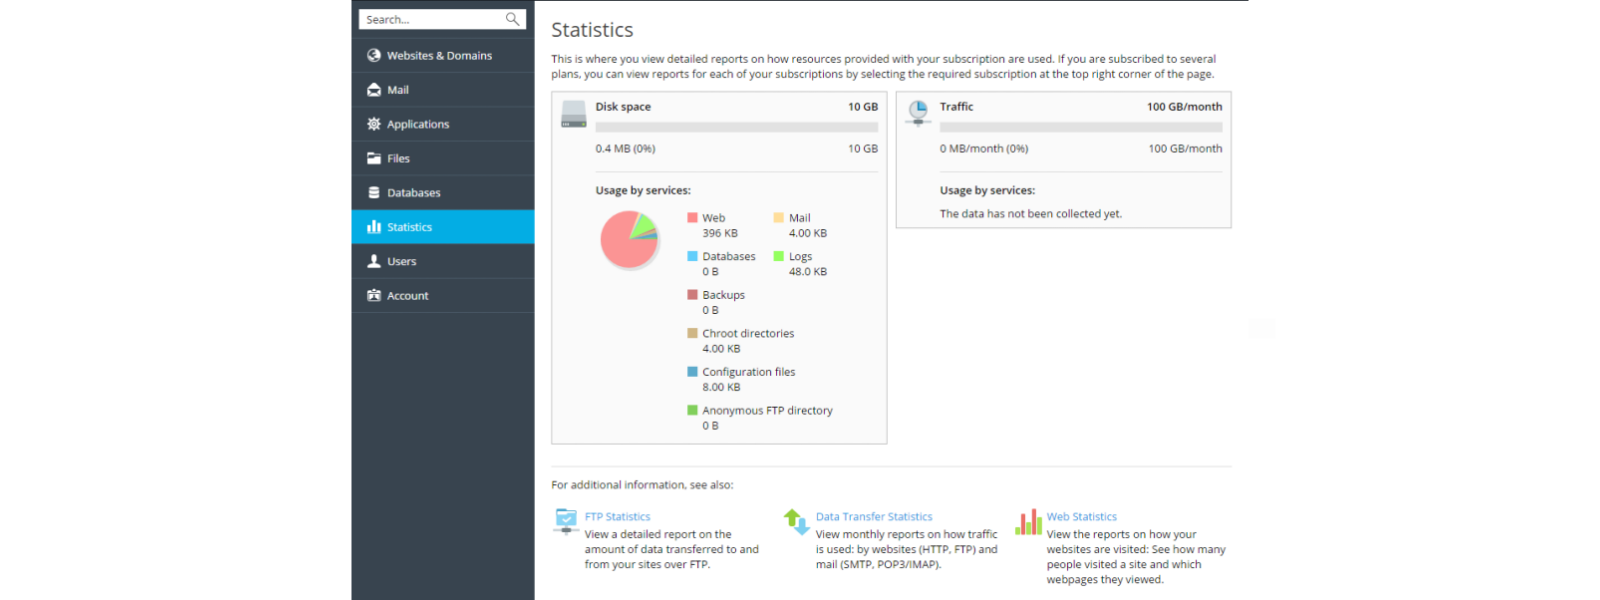
If you need to analyse your global host account footprint or monthly data consumption limits instead of human traffic logs, return to the Plesk home navigation bar menu. Click directly on the dedicated Statistics button option listed in the main sidebar.
- Action: The interface will render a centralised breakdown detailing your active hard drive storage allocation and total multi-megabyte monthly bandwidth transfer summaries.
What Happens Next?
Once your statistics software engine assignment registers, data processing is sustained continuously.
- Continuous Updates: Server logs compile network hits dynamically in the background, updating your reporting dashboards periodically.
- The Log Recalculation Loop: Reviewing the central statistics page layout allows you to monitor exactly which directories are consuming your account disk boundaries so you can optimise space easily.
Important Things to Know
- The Generation Delay: If you recently activated the stats tool or launched a brand new domain name, your reports frame may read empty. Plesk requires an operational processing loop of up to 24 hours to generate initial data charts.
- Independent Statistics Utilities: Toggling or changing your software reporting app only modifies your visual interpretation layer; it does not purge or rewrite your core historical website data files.
- Bandwidth Boundaries: Exceeding monthly allocation caps can trigger automated hosting suspensions. Auditing the central report pane frequently keeps you informed of spikes before limits are crossed.
Common Mistakes to Avoid
- Checking for visual charts immediately after deploying a brand new domain name before the 24-hour compilation cycle runs.
- Mistakenly assuming that a lack of visible data tracking points means your public website has completely crashed or broken down.
- Forgetting to verify traffic metrics across the secure Web Statistics SSL/TLS link parameter layout option if your site runs entirely over HTTPS.
- Disregarding high storage usage spikes inside temporary logs directories, which can cause full subscription locks.
If This Didn’t Work
If your tracking reports continue showing blank screens or throw access rejections after waiting a full 24-hour cycle, confirm that your domain nameservers are pointing correctly to our hosting nodes.
You’re Ready!
Your server-side traffic monitoring and storage reports are completely configured inside your Plesk system layout. Monitoring these reports allows you to track marketing performance, protect system files, and scale your digital assets with complete confidence.
Related Articles
- Updating PHP Versions in Plesk
- How to Enable or Disable PHP Error Reporting in Plesk on 1-grid Hosting
Need Help?
If your analytics panels fail to open after changing your configurations, or if you require an engineer to clear an account storage threshold block, contact us. Our Support Team is ready to provide support and guidance.
Before logging a ticket, please have the following ready:
- Your primary domain name and active server plan metrics
- The explicit statistics software variant type selected inside your settings panel
- A screenshot of your Statistics interface views or error notifications
- The approximate timeframe the reporting delay was first noted